 VITO collection catalog
Categories
Keywords
Resolution
-
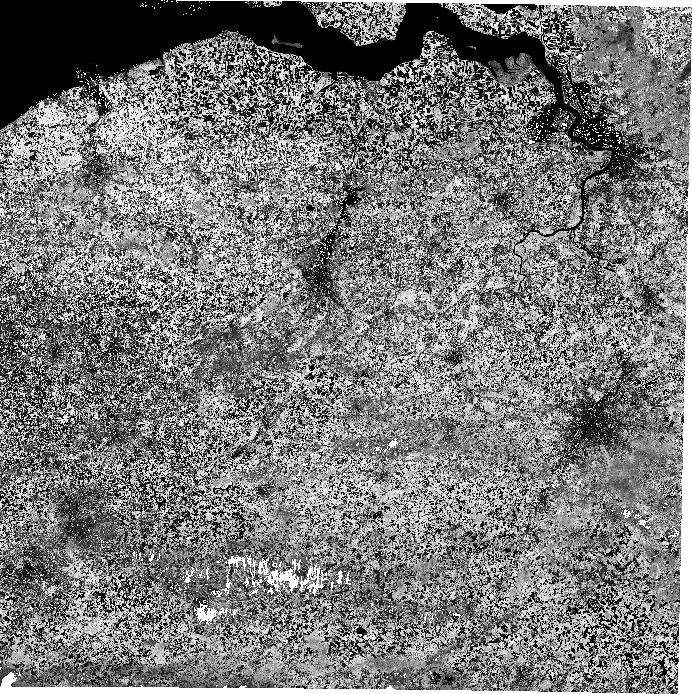
Radiometrically corrected Level 1B data (i.e. unprojected TOA reflectance), given per strip/camera. Pixel digital numbers are converted to radiance values. Image remains in raw sensor geometry (unprojected). The spatial resolution varies between 100 and 300 for VNIR and between 200 and 600 for SWIR.
-
Fraction of vegetation Cover (FCOVER) corresponds to the gap fraction for nadir direction. It is used to separate vegetation and soil in energy balance processes, including temperature and evapotranspiration. It is computed from the leaf area index and other canopy structural variables and does not depend on variables such as the geometry of illumination as compared to FAPAR. For this reason, it is a very good candidate for the replacement of classical vegetation indices for the monitoring of green vegetation. Because of the linear relationship with radiometric signal, FCOVER will be only marginally scale dependent. Note that similarly to LAI and FAPAR, only the green elements will be considered, either belonging both to the overstorey and understorey.
-
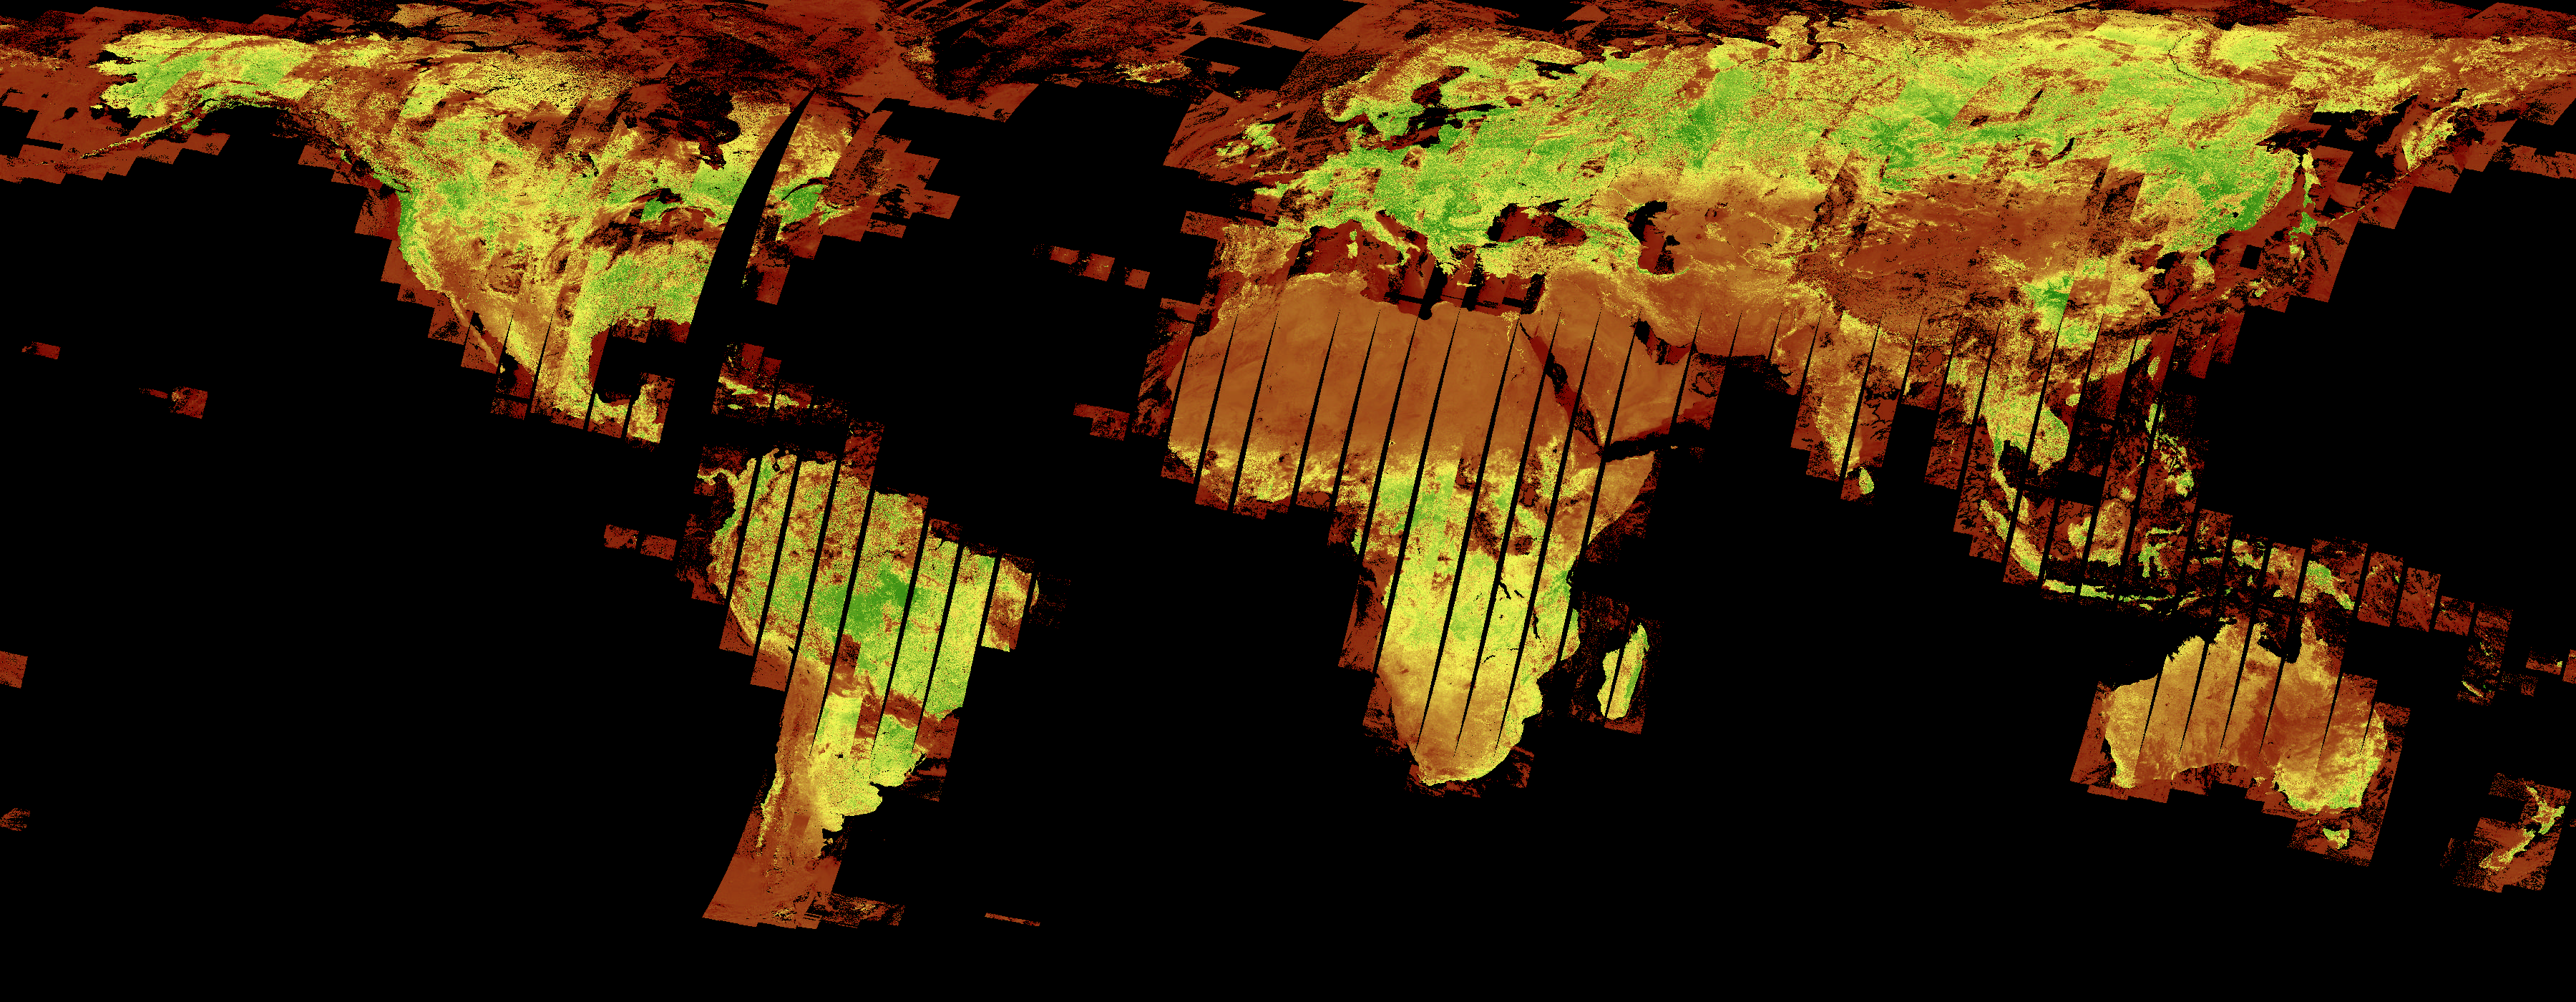
The SENTINEL-2 Normalized Difference Vegetation Index (NDVI) is a proxy to quantify the vegetation amount. It is defined as NDVI=(NIR-Red)/(NIR+Red) where NIR corresponds to the reflectance in the near infrared band , and Red to the reflectance in the red band. It is closely related to FAPAR and is little scale dependant.
-
Level 3 data products are variables mapped on uniform space-time grid scales and are the result of combining multiple scenes (e.g. S1/S10) to cover the user’s region of interest.
-
Level 3 NDVI data products are variables mapped on uniform space-time grid scales and are the result of combining multiple scenes (e.g. S1/S10) to cover the user’s region of interest.
-
FAPAR corresponds to the fraction of photosynthetically active radiation absorbed by the canopy.The FAPAR value results directly from the radiative transfer model in the canopy which is computed instantaneously. It depends on canopy structure, vegetation element optical properties and illumination conditions. FAPAR is very useful as input to a number of primary productivity models which run at the daily time step. Consequently, the product definition should correspond to the daily integrated FAPAR value that can be approached by computation of the clear sky daily integrated FAPAR values as well as the FAPAR value computed for diffuse conditions. The SENTINEL 2 FAPAR product corresponds to the instantaneous black-sky around 10:15 which is a close approximation of the daily integrated black-sky FAPAR value. The FAPAR refers only to the green parts of the canopy.
-
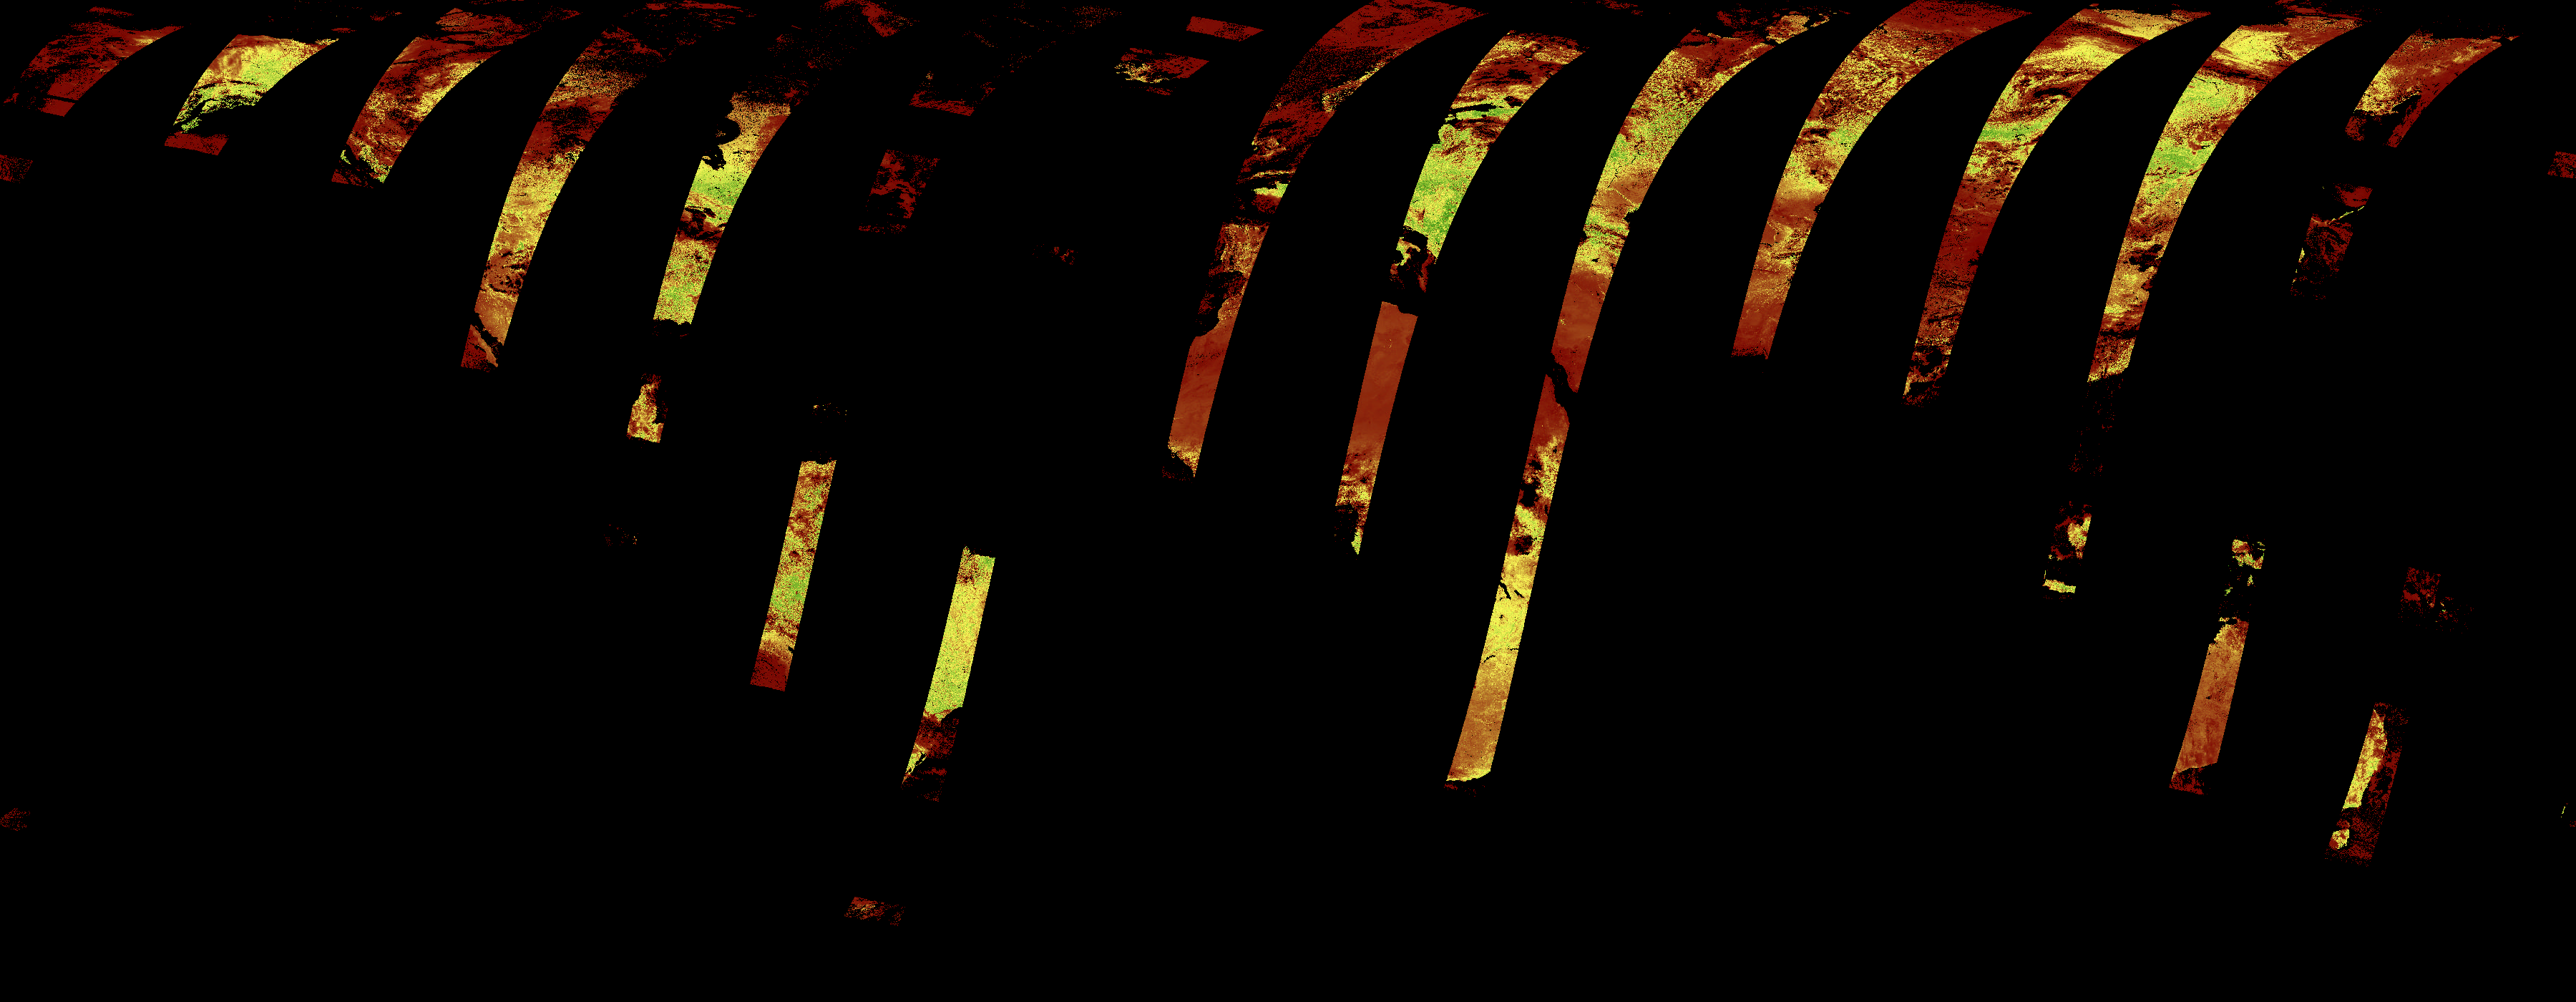
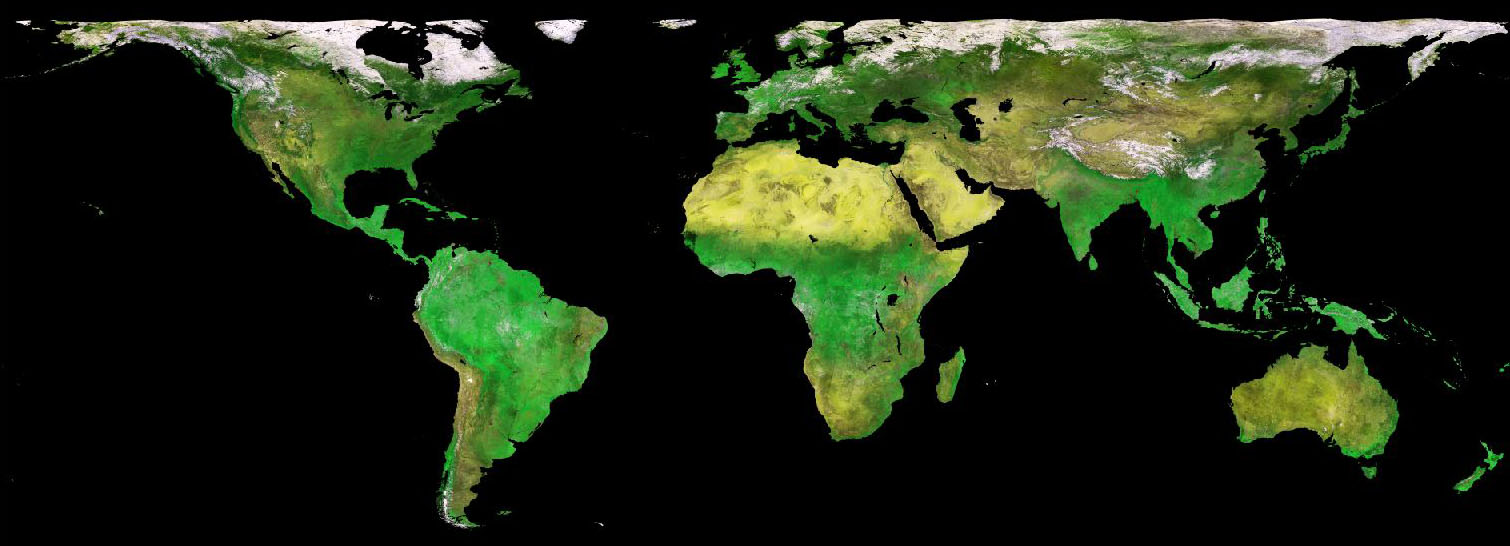
The "ENDVI10" or EUMETSAT Polar System NDVI are near-global, 10-daily composite images which are synthesised from the "best available" observations registered in the course of every "dekad" (10-day period) by the orbiting earth observation system MetOp-Advanced Very High Resolution Radiometer (AVHRR). The product provides the Normalized Difference Vegetation Index (NDVI), together with ancillary data, as well as the surface reflectance bands from which the ENDVI is calculated. The European MetOp satellites were conceived by the European Space Agency (ESA) and the European Organization for the Exploitation of Meteorological Satellites (EUMETSAT) to complement the geostationary METEOSAT satellites. In this way, they are analogue to the North-American National Oceanic and Atmospheric Agency (NOAA) platforms, which accompany the Geostationary Observational Environmental Satellite-East and -West (GOES-East and -West, respectively). Since mid-2007, MetOp thus occupies the "morning orbit", while NOAA assumes the "noon orbit": the local solar time of the overpasses is around 08:45 h for MetOp-A and 09:30 h for MetOp-B, while the NOAA satellites have an overpass time of for MetOp 14:00h. Both platforms carry the same AVHRR instrument, which scans the full earth surface at 1 km resolution in five spectral bands: RED, Near Infrared (NIR), Short-Wave Infrared (SWIR), Thermal Infrared 1 (TIR1), and Thermal Infrared 2 (TIR2).. Compared to NOAA-AVHRR, the MetOp-AVHRR has been enhanced in three ways: the platform is perfectly stabilised which guarantees an optimal geo-correction of the imagery, all registered 1 km observations are stored on-board and transferredto the central processing centre of EUMETSAT (Germany) via the antenna of Svalbard (Sweden). EUMETSAT performs the most crucial enhancement steps (rectification, calibration, cloud/snow detection) and broadcasts the results in real-time via its EUMETCast system.
-
The "ENDVI10" or EUMETSAT Polar System NDVI are near-global, 10-daily composite images which are synthesised from the "best available" observations registered in the course of every "dekad" by the orbiting earth observation system METOP-AVHRR. The product provides the Normalized Difference Vegetation Index (NDVI), togetehr with some ancillary data as the radiation reflectance bands. The European METOP satellites were conceived by ESA/EUMETSAT to complement the geostationary METEOSATs. In this way they are analogue to the North-American NOAA-platforms which accompagny the geostationaries GOES-East and -West. Since mid-2007, METOP thus occupies the "morning orbit" while NOAA assumes the "noon orbit": the local solar time of the overpasses is around 9h30' for METOP and 14h for NOAA. Both platforms carry the same AVHRR instrument which scans the full earth surface at 1km resolution in five spectral bands: RED, NIR, SWIR, TIR1, TIR2. (During the night the SWIR-band is switched to MIR, but the ENDVI10 only deal with daytime registrations). Compared to NOAA, the METOP-AVHRR has been enhanced in three ways: the platform is perfectly stabilised which guarantees an optimal geo-correction of the imagery, all registered 1km data are stored on board and chanelled via the antenna of Svalbard (Sweden) to the central processing centre of EUMETSAT (Germany), and the latter performs the most crucial enhancement steps (rectification, calibration, cloud/snow detection) and broadcasts the results in real-time via its EUMETcast system.
-

CWC corresponds to the Chlorophyll Water Content.
-
Level 3 data products are variables mapped on uniform space-time grid scales and are the result of combining multiple scenes (e.g. S1/S5/S10) to cover the user’s region of interest.